
Skeleton Juxtaposer
2019-11-08 see initial_dataset_visualization.ipynb for the latest working code.
Goal: Provide some Jupyter notebook based UI for evaluating how a generated SWC skeleton file compares to a gold standard skeleton for a given neuron image stack. I.e. this is the dashboard for someone actually evaluating challenge results.
This notebook will not make SWC files, it simply renders pre-generated SWCs. This should be the main UI tool for evaluation. The SWC generation notebooks will only have sanity check 2D project plots. Comparison UI happens here.
For more on the project's context, see rightfield neuron reconstruction challenge.
Status
Colab can be limiting in what UI is allowed, so this notebook is the point for collecting those limitations. Binder is much freer; that will be a separate notebook, after Colab is worked out first.
- 2019-11-08
- Note some of this is already in initial_dataset_visualization.ipynb so this notebook is really just a break out of the skeleton-atop-MinIP code to a separate tool.
- 2019-10-13
- started testing Colab-friendly UI tools for SWC viewing
- 2019-10-12:
- Spun up this file, with some notes
UI inspired by paper handout from challenge meeting
Minimally, the evalution viewer notebook should essentially repreduce the paper handout from the evalution meeting of 2019-10-04. It should be a stand alone tool which simply loads an image stack and 2 SWC files.
Basically, this notebook should show 5 images side-by-side, horizontally inline:
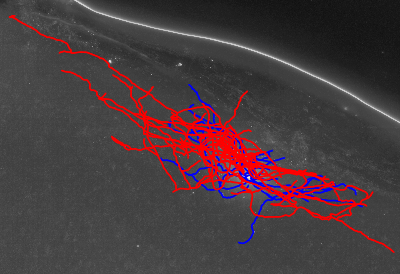
- The original brightfield "cover image"
- Gold standard SWC front view
- Gold standard SWC side view
- Generated SWC front view
- Generated SWC size view
Note that the above initial solution is not interactive at all; it is very much inspired by the paper handout (it also minimizes the required features for an initial deliverable; hopefully, an interactive version will come soon after the initial drop, dunno.)
Due to the limits of Colab (only so much time (12 hours), memory, and file system is given to the free tier) the Colab deploy of the challenge code will only process a single neuron image stack at a time.
This tool should just show one neuron image stack and one reconstruction on a page (two reconstructions actually: the gold standard and a given second generated SWC reconstruction).
Demonstrating how to process just one neuron is sufficient for folks to figure out how to repeat for all neurons in the dataset. (Might even get to a drop down for choosing which neuron to trace.)
So, this notebook will be the equivalent of one third of a paper handout from the 2019-10-04 meeing, which was comparing 3 candidates, each page showing the above 5 images, 3 times a page, once for each of the 3 candidates.
Features
Here's just a list of ideas.
3D volume viewer: The sky's the limit for JupyterLab widgets but on Colab, UI options are much more constrained. Currently, what 3D volume viewer to use is an open question, one that would be trivial on a generic JupyterLab deploy.
Synced interactive: show both SWCs in dual side-by-side volume displays, or as layers of one single volume displayer. So moving one view makes the same camera movement happen in second displayer.
Hopefully eventually this page can score the quality of a generated SWC scored against a gold standard manual reconstruction SWC. But that is a completely open question. Evaluation in the challenge was initially done using human expert judges. There is no scoring software.
# Install BlueBrain's NeuroM toolkit for the analysis and processing of neuron morphologies.
# https://github.com/BlueBrain/NeuroM
!pip install neurom
!morph_stats /content/granuleCell63XStart/granule-.auto.swc